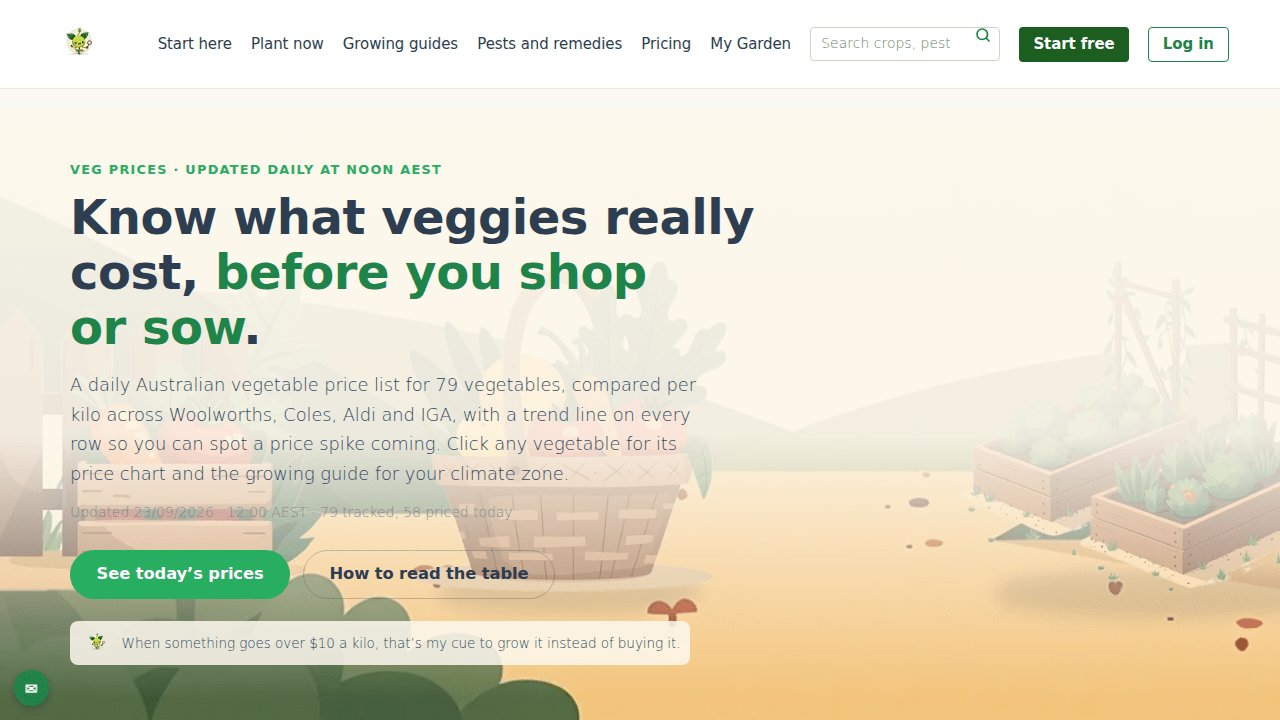
Every day, four supermarket chains change their vegetable prices, and most gardeners never see it happen. GardenBuddy.au’s price tracker checks Woolworths, Coles, Aldi and IGA daily and lines up the current price for 79 vegetables side by side, so you can tell what is worth growing yourself and what is cheap enough to just buy this week. Here is what it shows and how to actually use it.
A minute and a half on what the price tracker shows and how to read it.
What the price tracker actually shows
Open gardenbuddy.au/prices/ and you get one row per crop. Each row carries a small trend sparkline of the monthly averages tracked so far, today’s average price per kilo, a movement arrow, and the actual price at each of the four retailers, Woolworths, Coles, Aldi and IGA. IGA is marked “limited” because it stocks fewer of these crops than the other three.
The movement arrow is worked out month over month. Anything moving more than 1% either way gets a rising or falling arrow, within 1% counts as steady. A red arrow up of 15% or more over a run of weeks usually means a genuine supply squeeze, floods, drought or an insect problem hitting commercial growers. A green arrow down of 15% or more usually means growers harvested more than the market needed, a glut.
Not every one of the 79 tracked vegetables has a per kilo price on a given day, some shops rotate stock or run out of a line, so the header on the live page shows both figures, how many are tracked and how many were actually priced that day.
Why the average is not always four shops
The GardenBuddy.au team found early on that a straight four shop average can produce a number that is on no shelf anywhere. Lettuce was the example that forced the fix, Coles had an iceberg, IGA an oak leaf, Aldi a bag of shredded iceberg and Woolworths a pack of cos hearts. Averaging all four gave a price nobody could actually pay.
So the tracker works out what is actually being priced before it averages anything:
- One variety. If the average is for granny smith apples specifically, the page says so under the figure.
- One portion. Half a cabbage is not a cabbage, and a bunch is not a punnet.
- A shop selling something else still gets its own row, at its own price, labelled with what it is actually selling, and it is left out of the average.
- Where only one shop stocks a crop, the tracker says “only Aldi prices this” rather than calling a single price an average. Around a dozen crops read that way on any given day.
Sold by the item, not by weight
Some produce, herbs especially, never gets a per kilo price at any shop, a bunch of basil is just $3.30, full stop. Rather than inventing a weight nobody published to force a $/kg figure, around 20 of these crops sit in their own table with the shop’s own unit, each, a bunch, a half or a pack. It is a different unit to the $/kg table on purpose, so the two are never meant to be compared directly.
How to use it
- Quick shopping check: sort the table by price to see what is cheapest today, and shop around the four retailers accordingly.
- Season planning: before you plant, filter to “Rising” and look for crops that have been climbing over several weeks. A capsicum sitting at $14/kg for six weeks running is telling you your $2 of seed is worth a lot more than usual.
- Don’t waste bed space: filter to “Falling” for crops in glut. If the shops are cheap and staying cheap, that is bed space better used on something else this season.
- Dig into one crop: click any vegetable name for its own price history chart, a per retailer breakdown, growing guide links for your climate zone, pest warnings, and an estimate of what growing it yourself would save you. The last three months of the chart are free, the full tracked history is on the Starter and Pro plans.
Where the data comes from
Prices are collected automatically every day, nobody types these numbers in by hand. Collection starts at 10:00 AEST across all four retailers, and the figures are processed and live on the page by around midday AEST. Check the tracker in the afternoon and you are looking at that morning’s numbers, check it before midday and you are seeing the previous day’s collection.
Collection is not perfect and the GardenBuddy.au team publishes the real failure rate rather than hiding it. The overall null rate across all four retailers is 0.8%. Woolworths is read from a stable API and comes back at 0.0% nulls, IGA also reads at 0.0%, Coles sits at 0.6%, and Aldi is the highest at 2.3% because its weekly specials rotation regularly breaks the page layout the collector reads. When a price comes back null for a shop, that shop’s column is left blank for the day and the average is taken from whichever shops did return a price.
Price history only goes back as far as April 2026, when collection began, so the trend chart on the main table builds up a month at a time rather than showing a full year from day one.
Frequently asked questions
Do I need an account to see the prices? No. The full table at /prices/ is open to everyone, no login required.
Why does a vegetable show “only Coles prices this” instead of an average? Because averaging one shop’s price with itself is not an average, it is just that shop’s price. The tracker says so plainly rather than dressing a single number up as a four shop figure.
Why can’t I compare the per kilo table to the sold by the item table? They are different units. One is a calculated $/kg figure, the other is the shelf price for a bunch, a pack or an item as the shop actually sells it. Converting between them would mean guessing a weight nobody published.
How far back does the price history go? Collection started in April 2026. The free chart on a vegetable’s own page shows the last three months, the full tracked history is available on the Starter and Pro plans.
Related features
The price tracker works best alongside a couple of GardenBuddy.au’s other tools.
- Reading a per-veggie page: what the price history chart, retailer breakdown and ROI estimate on each crop’s own page actually mean.
- Your ROI report: turns a rising shop price into an actual dollar estimate of what growing that crop yourself would save you.
- Plant Now: once a price trend tells you a crop is worth growing, this tells you whether now is actually the right time to plant it in your zone.
Try it now
Head to gardenbuddy.au/prices/ and see today’s prices across all four shops. No account needed to check them, and no credit card if you want to go further with a free GardenBuddy.au account.