

User guide · features and tools · 6 min read
One crop, a year of prices, and whether it is worth growing.
Click any crop name on /prices/ and you land on the per-veggie detail page, price history chart, per-retailer breakdown, a grow-vs-buy ROI estimate for home gardeners, pest warnings, and a buy-seeds link.
 The grow versus buy figure is an estimate, and the page says how it is worked out.
What’s on the page
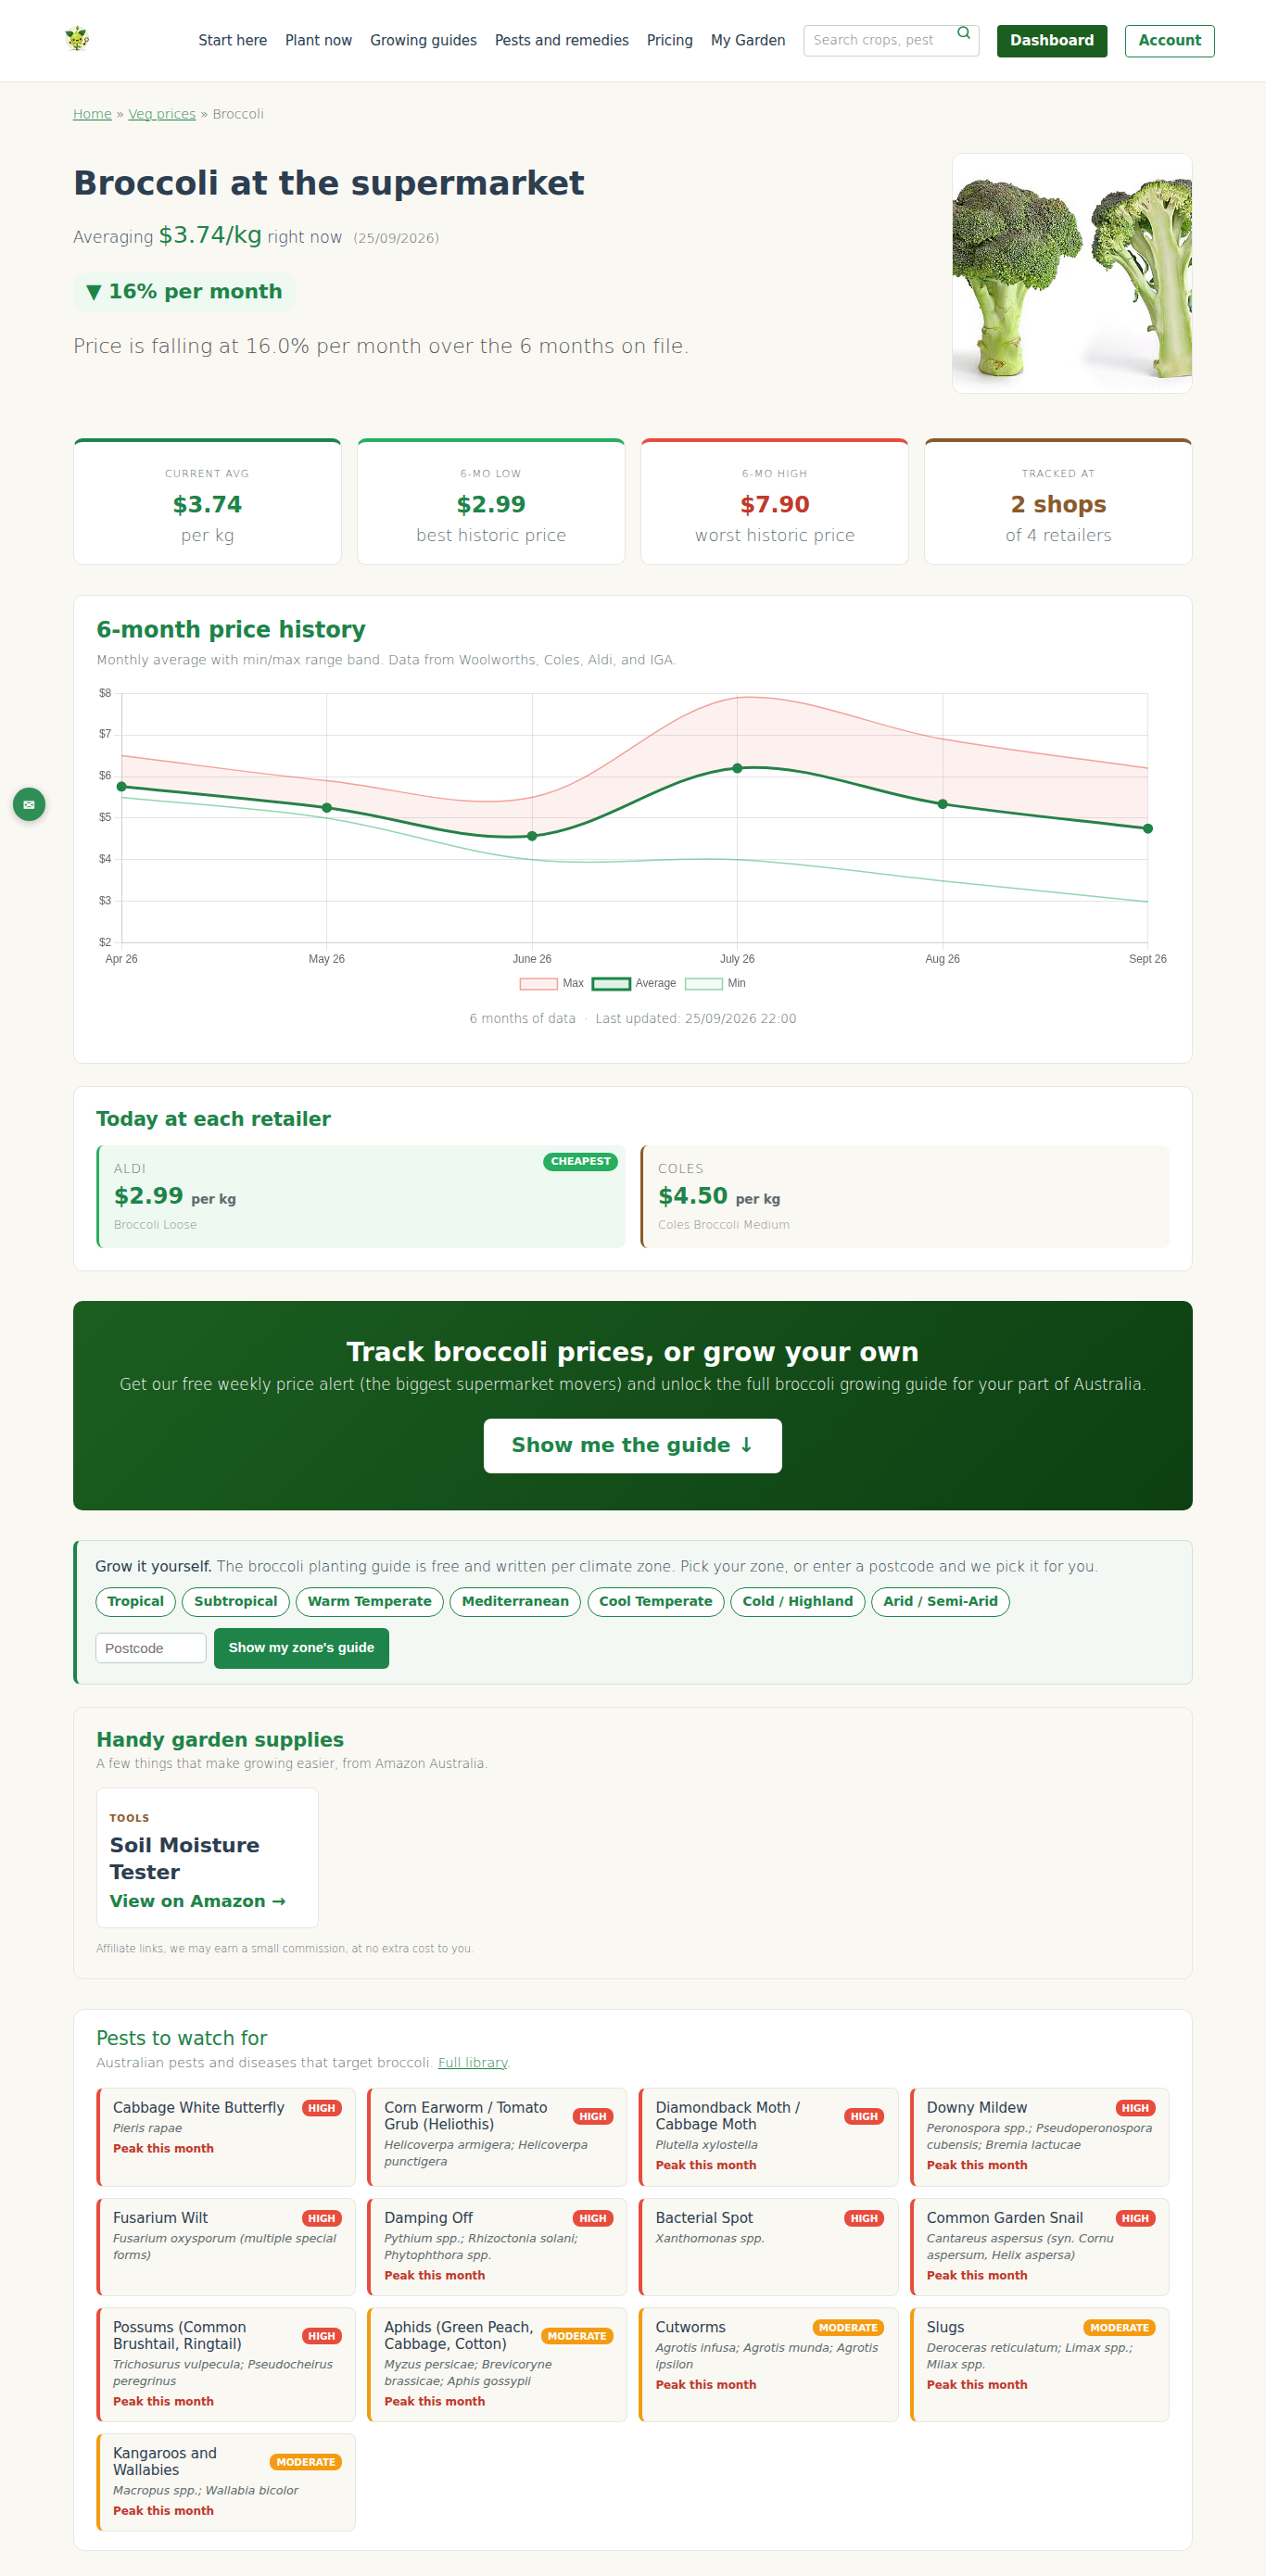
Click any crop name on /prices/ and you land on the per-veggie detail page. Example: /prices/broccoli/.
Seven sections stacked top to bottom:
1. Today’s price summary
Today’s average in big numbers, and the date it was collected. The snapshot answer to “what does this cost today?”
Read the wording of that headline, because it is doing real work. “Averaging $7.44/kg” means several shops agreed on the same thing. “Only Aldi prices this, at $12.48/kg” means one shop stocks it and we would rather say so than dress a single price up as an average. And where the crop has more than one variety on the shelves, a line underneath names the one the figure is for, such as “that is for granny smith, the variety the most shops stock”.
Some crops have no per-kilo price anywhere, because the shop only ever prints a price for the item. Those read “Averaging $3.40 per bunch” or “$4.21 per half” instead. That is the shop’s own printed figure and it is never converted to a $/kg, because converting it would mean inventing a weight.
2. Per-retailer breakdown
Woolworths, Coles, Aldi and IGA with today’s price for each, and the product name that price is for. If a shop has no price for the crop today, its row is left out rather than filled with a guess.
A shop that stocks a different variety, or sells it halved when everyone else sells it whole, still gets its row at its own price with its own label. It just sits outside the average, so the headline stays a figure you can match against one shelf. That is why a shop’s own number sometimes differs from the average above it, and it is deliberate.
Every one of these is meant to survive a check. Open the shop’s site, search the product name shown, and the price should be the one we published. Prices do move between our late-morning collection and your click, but the product and the figure should line up. If they do not, that is a fault and we want to hear about it.
3. Price history chart
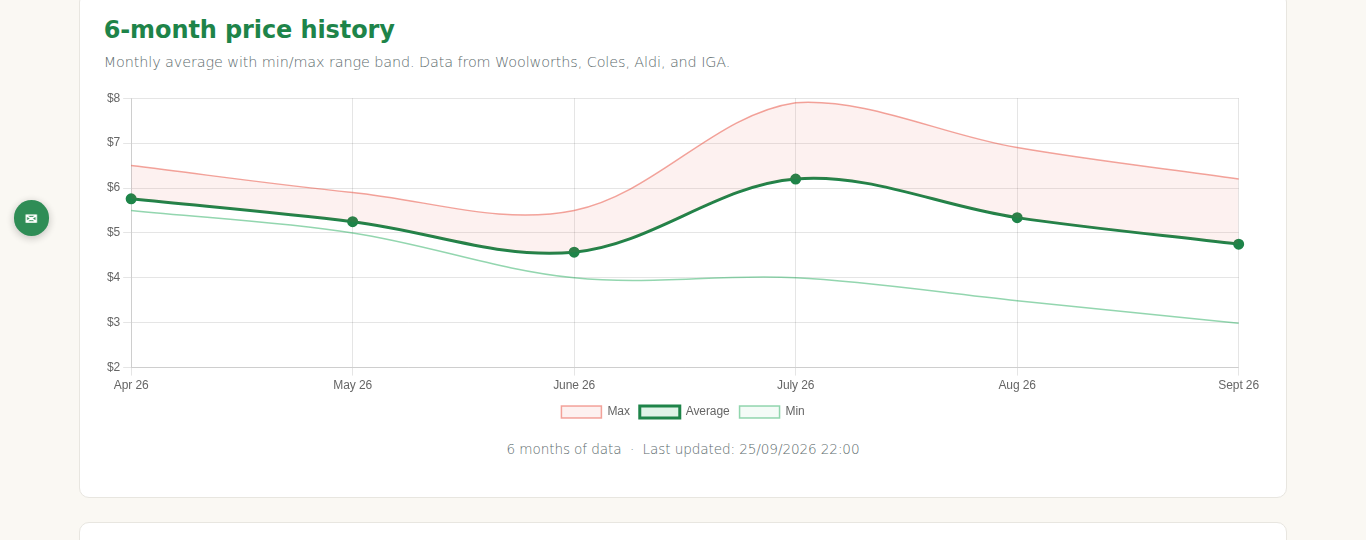
Line graph of the monthly average prices we have tracked. On the free tier you see the last 3 months; Starter and Pro members see the full history, which reaches back to when collection started in April 2026 and grows towards a full year. Hover for the values. Chart.js rendered, interactive on desktop and mobile.
4. Grow vs buy estimate
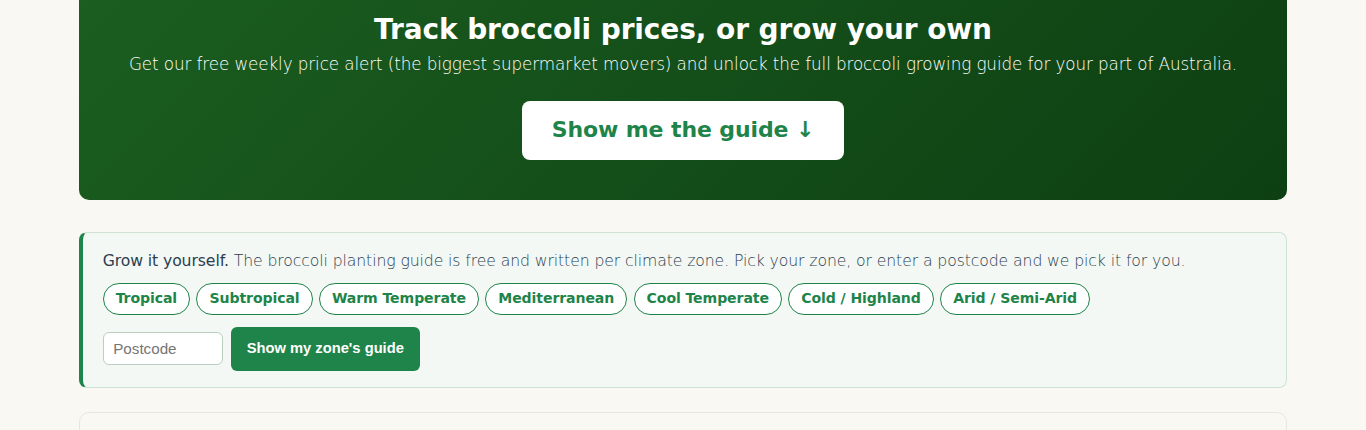
Estimated ROI of growing this crop at home in your zone. Uses typical yield per square metre for the crop, today’s shop price, and typical seed cost.
5. Planting guide link
Direct link to /veggie-guide/{your-zone}/{crop}/ for month-by-month planting advice specific to your zone.
6. Pest section
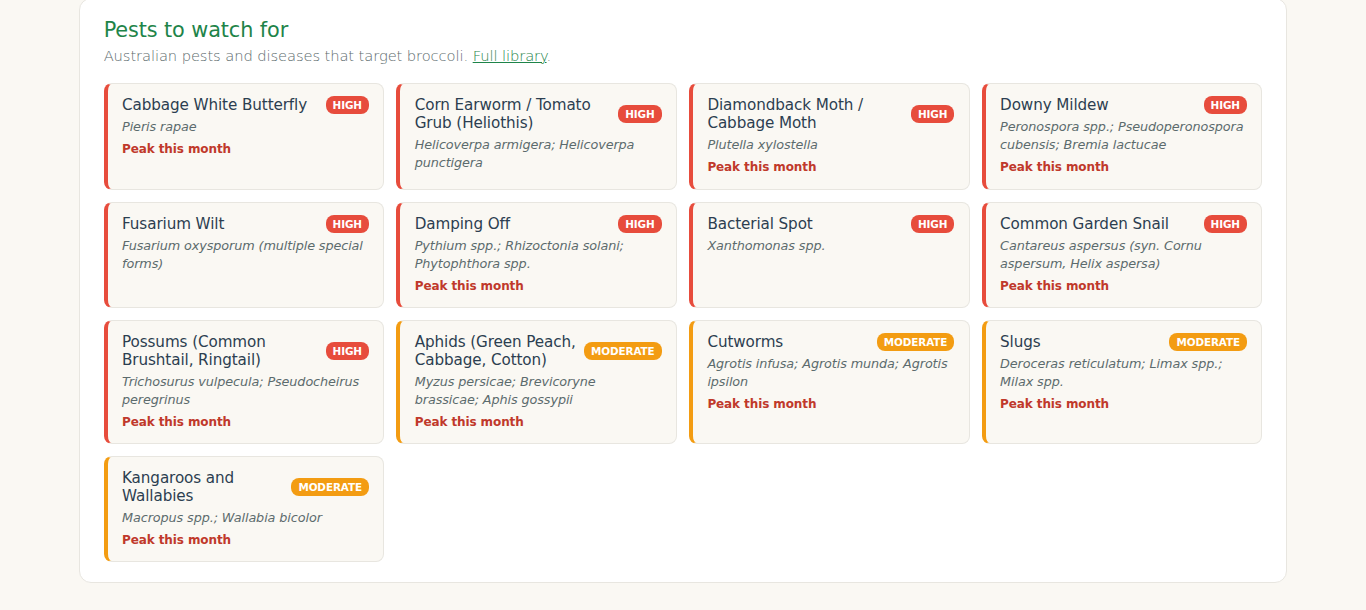
Pests to watch for in the current season. Links to treatment guidance.
7. Buy seeds link
A single link to buy seed for the crop online, or a link for plants where the crop is normally grown from a seedling or crown. It is an affiliate link and the page says so, we may earn a small commission at no extra cost to you.
The chart, what to look at
Spikes
Price jumps over 30% in a short window. Usually a supply disruption. Examples:
- Broccoli Feb 2026 spiked to $14/kg for 3 weeks, heat damage to Victorian commercial crops
- Lettuce Dec 2024 peaked near $12/kg, floods in the Lockyer Valley
- Capsicum perennially spikes in winter, ends of growing regions out of season
Worth knowing for context.
Seasonality
Most crops have an annual rhythm. Tomatoes peak (expensive) June–August (Australian winter), trough (cheap) January–March. Broccoli is opposite, cheap in winter when supply peaks, expensive in summer.
The seasonality pattern tells you when to buy vs grow.
Long drifts
Slow up or down movement over months usually reflects commodity-level changes (fuel, transport, labour costs) rather than local events. Less actionable but useful context.
Grow-vs-buy estimate
The ROI number on each veggie page uses:
- Typical yield per sqm at home, varies by crop (broccoli ~2 kg/sqm, kale ~3 kg/sqm, tomatoes 5–8 kg/sqm)
- Today’s shop price, per kilo where there is one
- Typical seed packet cost
Worked example
“Growing 2 sqm of broccoli in subtropical autumn: expected yield ~4 kg, value at current prices $23.20, seed cost $4.50, net saving $18.70 across a 90-day crop.”
These are estimates, not promises. Your actual yield depends on weather, pests, and how diligent you are. Compare with our demo garden’s real numbers for a reality check.
Buy seeds link
At the bottom of each per-veggie page there is one buy link for the crop, “Buy broccoli seeds on Amazon” for crops grown from seed, or a “find plants” link for the ones you would normally start from a seedling or crown. It takes you to a search for that crop, so you can compare varieties and sellers yourself.
It is an affiliate link and the page discloses that next to it: we may earn a small commission, at no extra cost to you. It does not change which crops we cover or what the price tracker reports.