Log in at gardenbuddy.au/dashboard/ and this is the page you land on. It is the member’s home, the one screen that pulls together your beds, this week’s jobs, real vegetable prices and a personal note from Buddy the Sprout Advisor, so you are not hunting through menus to see how your garden is going. Here is what is actually on it and how to use it.
A minute and a half on what your dashboard shows and how to read it.
What the dashboard actually shows
The top card greets you by name and shows your plan and climate zone, with your postcode and the nearest reference city underneath. From there, three buttons take you into the planner app, the garden map and the user guide. Right below that sits “This week in your garden,” dated to the current week for your own zone, starting with what is ready to pick right now.

Under that, the page splits into two columns. On the left, “Garden at a glance” gives you your bed count, active plants and open jobs in three numbers, plus a running AI credit balance and buttons into the planner app, the garden map, your journal and topping up AI credit. On the right, “Your vegetable prices” shows the current Australian average retail price for every crop you grow, with a trend arrow, sourced from the GardenBuddy.au price tracker.
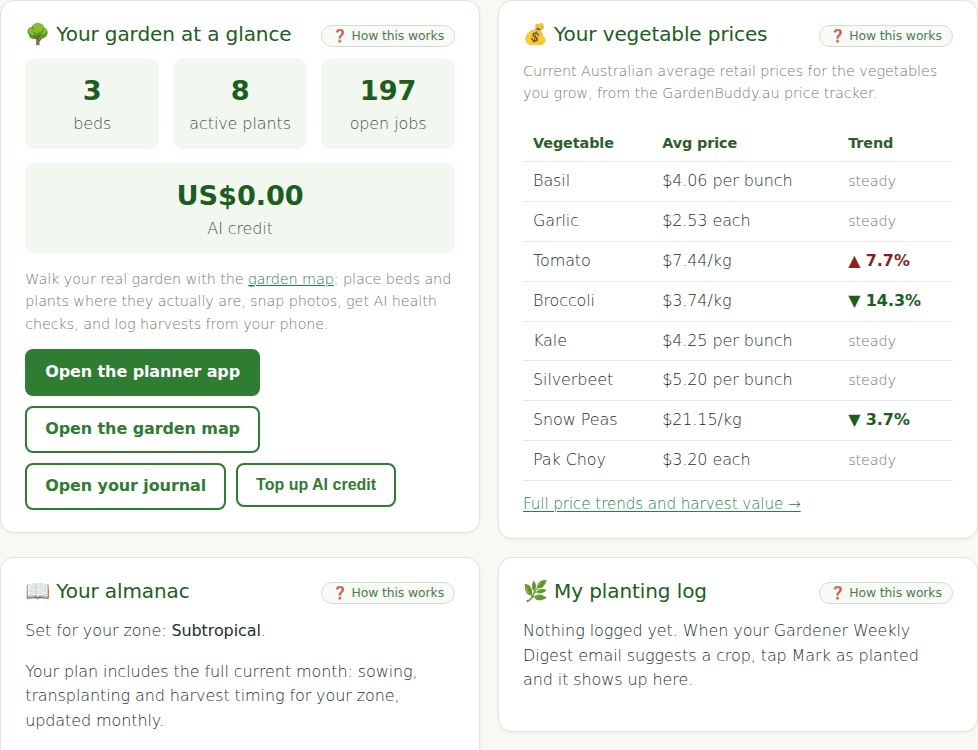
Further down the left column, “Your almanac” links to this month’s sowing, transplanting and harvest timing for your zone, and “While you were away” lists the latest blog posts and a log of your recent email alerts and digests since your last visit. On the right, “Your planting log” fills in once you start marking crops as planted from your weekly digest emails.
Your Buddy the Sprout Advisor note
Below the two columns sits a short, personal note from Buddy about what is worth watching in your garden this week, written for your zone and the crops you actually have in the ground. It is not a generic tip of the day, it is generated from your own garden and your own postcode.

Every bed, every planting, every job
“Your beds and plantings” lists every bed you have added, with its type and size, and every active planting with its variety and the day count since it went in. Buttons let you add a bed, start seeds in a tray, plant straight into a garden bed, or log a harvest. Recent harvests sit underneath, and two buttons export your journal and harvest log as CSV files. “Garden tasks” lists what is due, watering, feeding and weeding jobs by crop, and you tick each one off, or clear the whole list, from the same page.

Grow versus buy, in the Pro tools panel
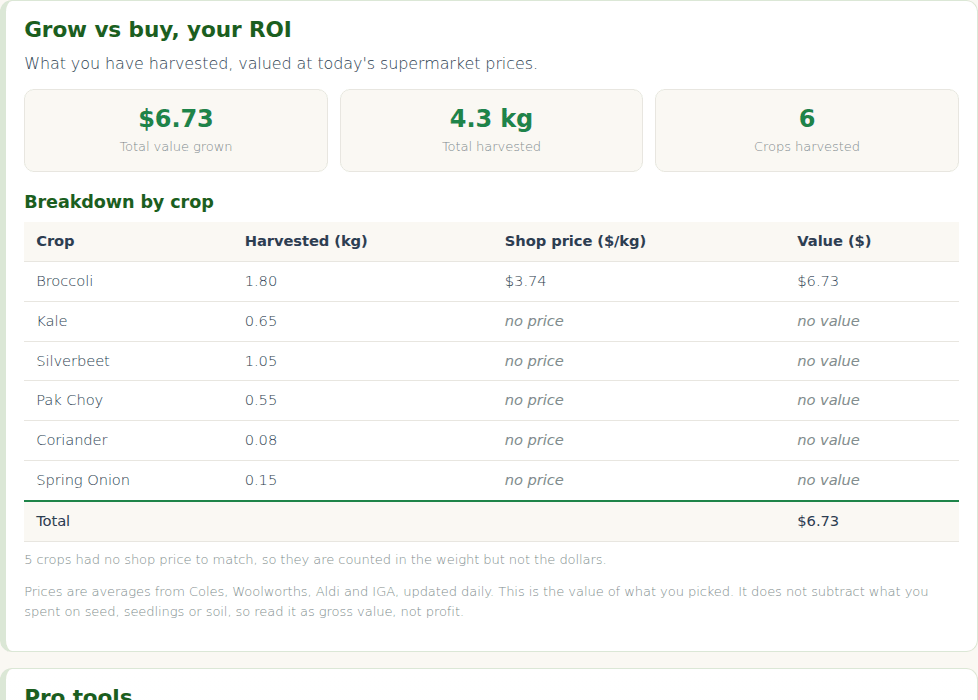
For members on a paid plan, the “Pro tools” panel turns your logged harvests into a dollar figure against today’s shop prices, crop by crop, with a total at the bottom. Crops with no matching shop price are counted in the kilograms but left out of the dollar total rather than guessed at. The same panel carries this week’s pest risk for your postcode, a link to set up your monthly price report, a 12 month price trend for the vegetables you grow, and succession planting suggestions for crops that are overdue to be sown again.
The dashboard finishes with a growing space question (ground or balcony), a sun hours chart for your location across the year, and a full list of what will grow in your zone with an “Add” button next to each crop, plus your plan and account settings.
Why it matters
A garden app is only useful if you actually open it. Splitting this information across a planner tab, a price page and an inbox full of digest emails means most of it never gets looked at again after the first week. Putting the jobs, the prices and the harvest numbers on one page you land on straight after logging in means the five minute Sunday morning check is enough to know what to pick, what to water and whether your garden is actually saving you money.
How to use it
- First thing, every visit: read “This week in your garden” for what is ready to pick, then check garden tasks for anything overdue.
- Weekly: glance at the vegetable price table. A crop trending up is a crop worth planting more of if you can.
- After every harvest: log it from the beds and plantings panel, so your ROI total and price trends stay current.
- Once a season: use the succession planting list in Pro tools to catch anything overdue to sow again before it shows up as a gap in your beds.
Frequently asked questions
Do I need to be logged in to see it? Yes. The dashboard is the member’s home, so it only renders once you are signed in. Visiting it while logged out shows a guest version with a login prompt instead.
Is the ROI figure profit? No. It is the value of what you harvested at today’s average supermarket prices. It does not subtract what you spent on seed, seedlings or soil, so read it as gross value, not profit.
What if a crop I grow has no shop price? It is still counted in your total kilograms harvested, it is just left out of the dollar figure and marked “no price” rather than guessed at.
Is the Pro tools panel available to everyone? It is part of the paid plans. A free account still gets the beds, jobs, prices and the Buddy the Sprout Advisor note.
Related features
The dashboard is the hub. These are the tools it links out to.
- The planner app: draw your beds to scale and place plants where they actually are, which is what feeds the beds and plantings panel on the dashboard.
- Garden Map: the visual, photo based view of your garden that sits alongside the planner app.
- The live supermarket price tracker: the same price data that fills the vegetable prices table on your dashboard, with the full history behind each crop.
- Track pests and treatments: the pest risk feed that surfaces in the Pro tools panel.
- The Farmers Almanac: the month by month planting timing behind the “Your almanac” card.
Try it now
Log in at the member dashboard and see your own garden’s numbers instead of an example. If you are not a member yet, join GardenBuddy.au free, no credit card required, and it starts filling in the moment you add your first bed.