

User guide · weather and pest alerts · 5 min read
Know which pest is coming before it arrives.
Every day at 05:40 AEST we compute a 0–100 pressure score for each of 34 Australian garden pests, at your postcode, for the next seven days. High score = conditions are favourable for that pest right now. Low score = you can relax about it.
 A high score means conditions suit that pest, not that it is already in your beds.
What is a pressure score
A pressure score tells you, for a specific pest on a specific day at your postcode, how favourable the conditions are for that pest to be active or breeding. It isn’t a guarantee of an outbreak, it’s a weighted indicator.
| Score | What it means | What to do |
|---|---|---|
| 80–100 | Perfect conditions, in peak season, for a pest that affects your crops | Inspect weekly, prevention on now |
| 60–79 | Conditions are good for the pest but one factor is off (e.g. out of peak month) | Keep an eye out; soft preventive measures |
| 30–59 | Marginal, weather is OK but out of peak, or climate zone is borderline | Note it, no urgent action |
| < 30 | Not shown on the dashboard. Pest is not active in your conditions today | Ignore |
How we compute it
Each pest in our database has four relevant fields: its climate-zone list, its peak months (southern hemisphere calendar), its temperature range, and whether it needs humidity. We combine those with tomorrow’s BOM forecast for your postcode:
| Factor | Points | Logic |
|---|---|---|
| Climate-zone match | +10 (required) | If your zone isn’t in the pest’s zone list, score is 0, the pest doesn’t apply to you |
| Forecast temp inside the pest’s range | +40 | Exact overlap with [min_temp_c, max_temp_c] |
| Forecast temp near the range (±3°C) | +20 | Worth watching but marginal |
| Humidity favourable | +20 | Either the pest isn’t humidity-driven (auto-+20) OR rainfall chance ≥ 50% and the pest likes humidity |
| Peak month | +30 | The forecast day falls inside the pest’s peak months at your latitude |
The score is clamped to 0–100 and stored with a JSON trace of which factors contributed. A high score is never “conditions for one pest today” alone, it’s always at least zone-match + temperature + humidity + peak month stacking up together.
Where to see it
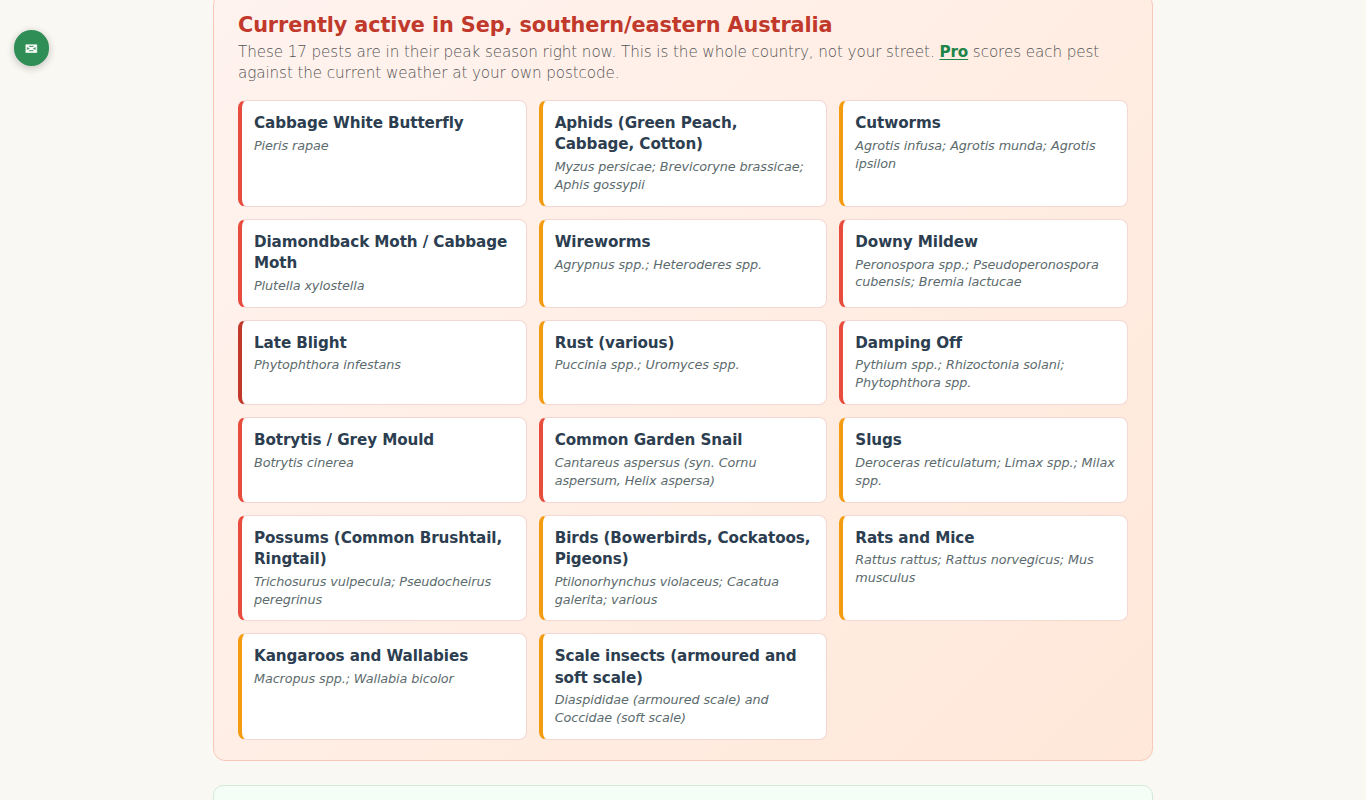
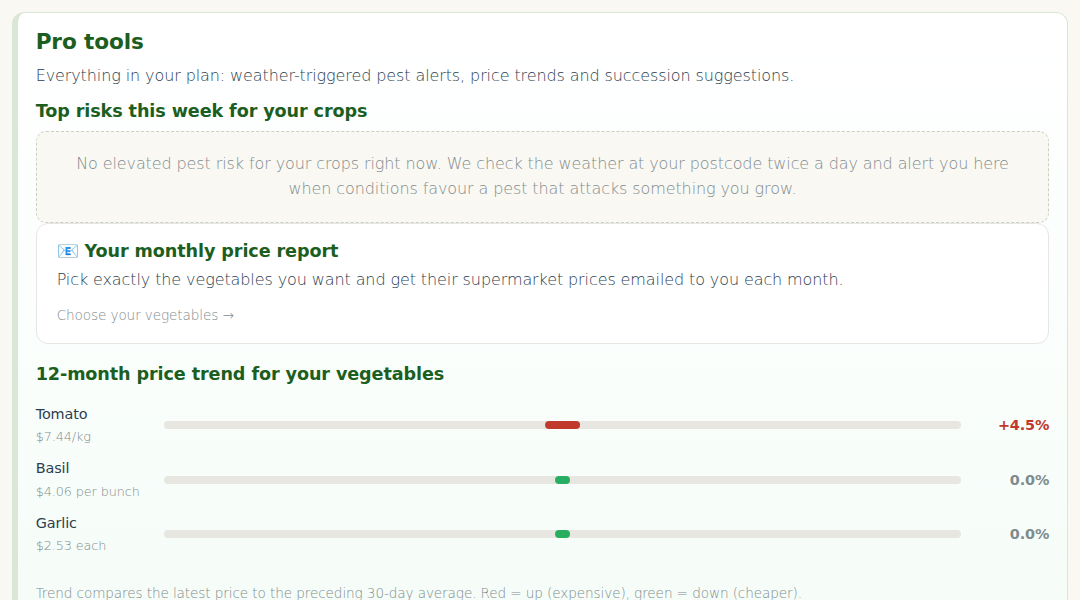
Live pest pressure is a Pro feature. Free and Starter members with a postcode see an upgrade prompt where the live band would sit, along with the static “currently active this month” list. Every paid plan starts with a 30 day $0 trial, so you can see your postcode’s live scores before paying anything.
On the Pests page
When you’re logged in on Pro and have a postcode, the /pests/ page shows a High risk at your postcode band at the top. It lists up to 8 pests with a score of 60 or higher over the next seven days, each with its score badge. Click through to read identification, prevention and organic treatment.
Without a postcode you see the static “currently active, this month” band instead, which is useful but not tuned to your weather.
On /my-garden/
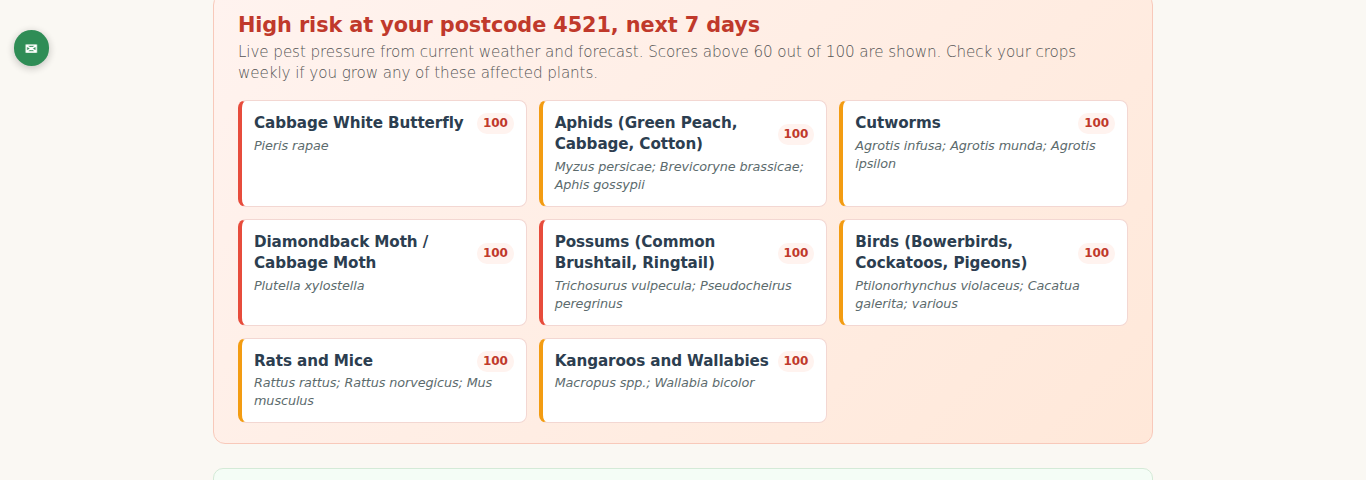
The dashboard reads your top five matched pests (after matching against the crops in your garden beds) from your user meta. Only pests that both score ≥ 70 and affect a crop you actually planted show here.
Refreshed twice a day at 06:00 and 18:00 AEST.
When to act
Don’t reach for a sprayer every time a score nudges past 70. Read the pest’s page first, organic treatments and prevention are always listed, chemical treatments only where they’re still legal in home gardens. A healthy garden tolerates low-grade pest pressure without intervention; what you want to prevent is a population explosion.
- Score rising into 80+ on a pest that affects a crop you grow → act this week. Inspect, set traps, start preventive covers or netting.
- Score steady at 50–70 for days → monitor. Hand-remove any you spot, don’t escalate.
- Score dropping after rain → common for dry-loving pests like spider mites. Rain helped you; note it.
Honest limits
Pressure scores are weather-based, not observation-based. They don’t know whether your specific neighbour’s tomato patch is already full of whitefly, or whether your brassicas are already netted. Treat the score as a prompt to look, not a replacement for looking.
- We compute pressure daily around 05:40 AEST, after the BOM feed refreshes. Same-day changes in conditions don’t show until tomorrow’s run.
- Humidity input is derived from rain-probability, not measured dew point. For a fungal-disease signal, the forecast is a rough proxy.
- The pest database currently covers 34 of the most common AU vegetable-garden pests. A few regional specialities (e.g. harlequin bug in WA brassicas) aren’t in there yet.
- If your crop isn’t in the pest’s
affected_cropslist, we won’t match it on the dashboard even if the pest is active in your area. Missing a crop mapping? Let us know and we’ll add it.