

User guide · features and tools · 6 min read
What the shops charge, updated daily.
/prices/ is the daily supermarket vegetable price tracker. 93 vegetables across Woolworths, Coles, Aldi and IGA. Updated every day by an automated price collector.
 Collected automatically every day. Nobody types these numbers in by hand.
What you see
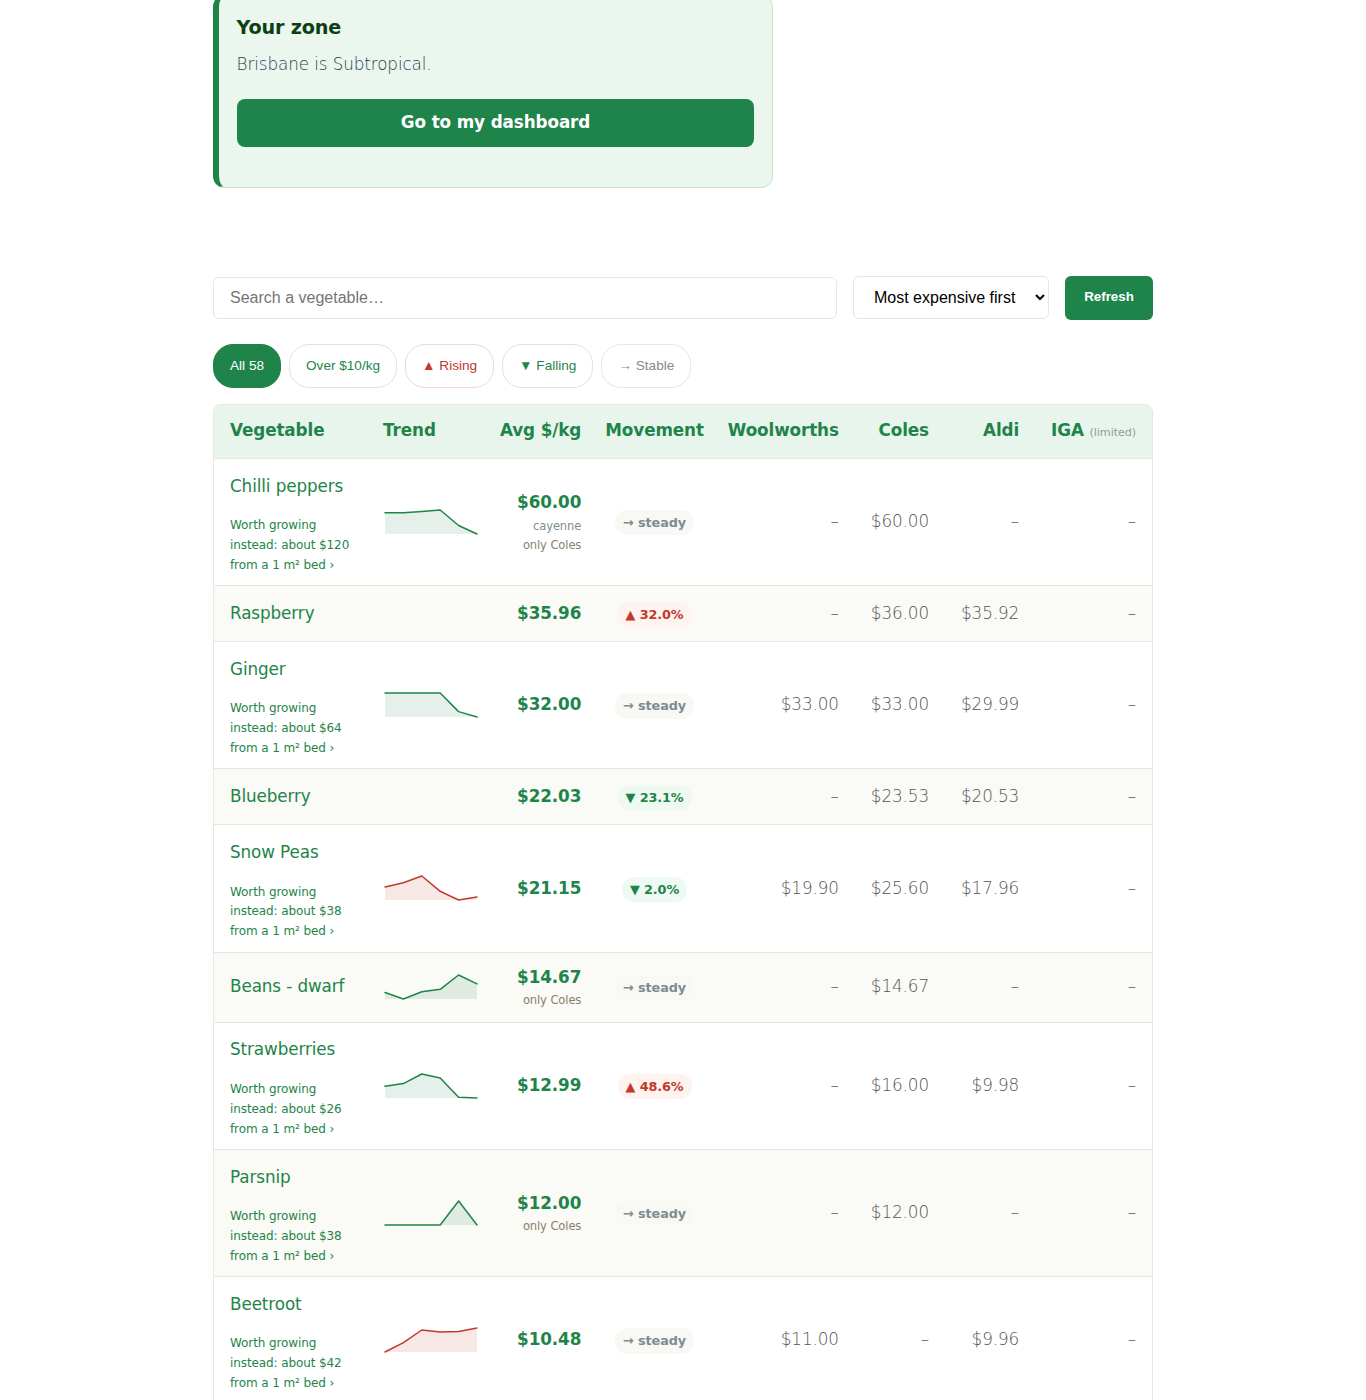
One row per crop. Columns:
- Vegetable, click it for the per-veggie detail page
- Trend, a miniature chart of the monthly averages we have tracked so far. History collection started in April 2026, so the line grows a month at a time until it covers a full year
- Avg $/kg, today’s average, worked out the way the next section describes
- Movement, ▲ rising, → stable, ▼ falling, worked out month-over-month. Anything moving more than 1% either way gets an arrow; within 1% counts as stable
- Woolworths, Coles, Aldi, IGA, one column each with that shop’s own price and the product it is for. IGA is marked “limited” because it carries fewer of these crops than the other three.
What the average actually averages
The figure in the Avg $/kg column is not always four shops, and that qualification is the entire point of it.
Lettuce is the example that made us change it. Coles had an iceberg, IGA had an oak leaf, Aldi had a bag of shredded iceberg and Woolworths had a pack of cos hearts. Averaging those four gave $3.02, a price that was on no shelf anywhere in the country. So the page now works out what is being priced first, and only then averages.
- One variety. If the average is for granny smith apples, the page says so in a line under the figure.
- One portion. Half a cabbage is not a cabbage, and a bunch is not a punnet.
- A shop selling something else still gets a row, at its own price, labelled with what it is actually selling, and it stays out of the average.
- Where only one shop stocks it, the page says “only Aldi prices this” rather than calling a single price an average. Around a dozen crops read that way on any given day.
- Mixed packs and near relatives are left out. A tray of assorted chillies is not a chilli price, and a wombok is not a cabbage.
The promise we hold ourselves to is one sentence. Open the shop’s own website, find the product named beside the price, and the figure should match. If it does not, tell us and we will fix it.
Sold by the item, not by weight
Some produce has no price per kilo anywhere. Coles prints $4.50 for a lettuce and that is all it prints. Those crops used to show nothing here at all, because the only way to reach a $/kg was to divide by a weight we made up, and then nobody could check it.
There is a second table further down the page for those. It shows what the shop printed, plus a “Sold as” column telling you whether that is each, a bunch, a half or a pack. Around twenty crops sit there, the fresh herbs among them. A Woolworths basil bunch is $3.30 and you can verify that in one click, which is worth a good deal more than a per-kilo figure we invented.
Do not compare a number from that table against one from the $/kg table. They are different units and we keep them apart deliberately.
How to read it
Big rising prices, grow your own
Red arrow up + ≥15% month-over-month = supply squeeze. Common triggers: floods, drought, imports delayed, insect pressure on commercial crops.
A capsicum at $14/kg for 6 weeks running means something went wrong with supply. It’s a signal that growing your own in season will pay off significantly, your $2 of seed is now comparable to $10 of shop produce.
Big falling prices, don’t bother growing this now
Green arrow down + ≥15% = glut. Growers harvested more than demand expected. Don’t waste bed space growing these right now, buy cheap, grow something else.
This is the single most actionable insight in the tracker. Scanning weekly saves you from planting crops that will be cheap at the shops by the time you harvest.
Stable prices, staples
Horizontal arrow = price held within ±1% month-over-month. These are the reliable “always worth growing” crops, no dramatic savings from home growing, no surprise costs at the shops. Staples.
Filters and sorting
Five quick filters top of the table:
- All, the default view. The button carries the live count of crops with a per-kilo price today, so it moves as shops stock and drop things.
- Over $10/kg, premium crops where growing your own pays off biggest
- ▲ Rising, up more than 1% month-over-month, worth watching. The bigger the rise, the stronger the grow-your-own case
- ▼ Falling, down more than 1% month-over-month, heading towards glut territory
- Stable, dependable staples
Sort by clicking any column header. Common sorts:
- Price descending, most expensive first (shopping planning)
- Trend descending, biggest risers first (growing priority)
- Alphabetical, reference lookup
Clicking a crop name
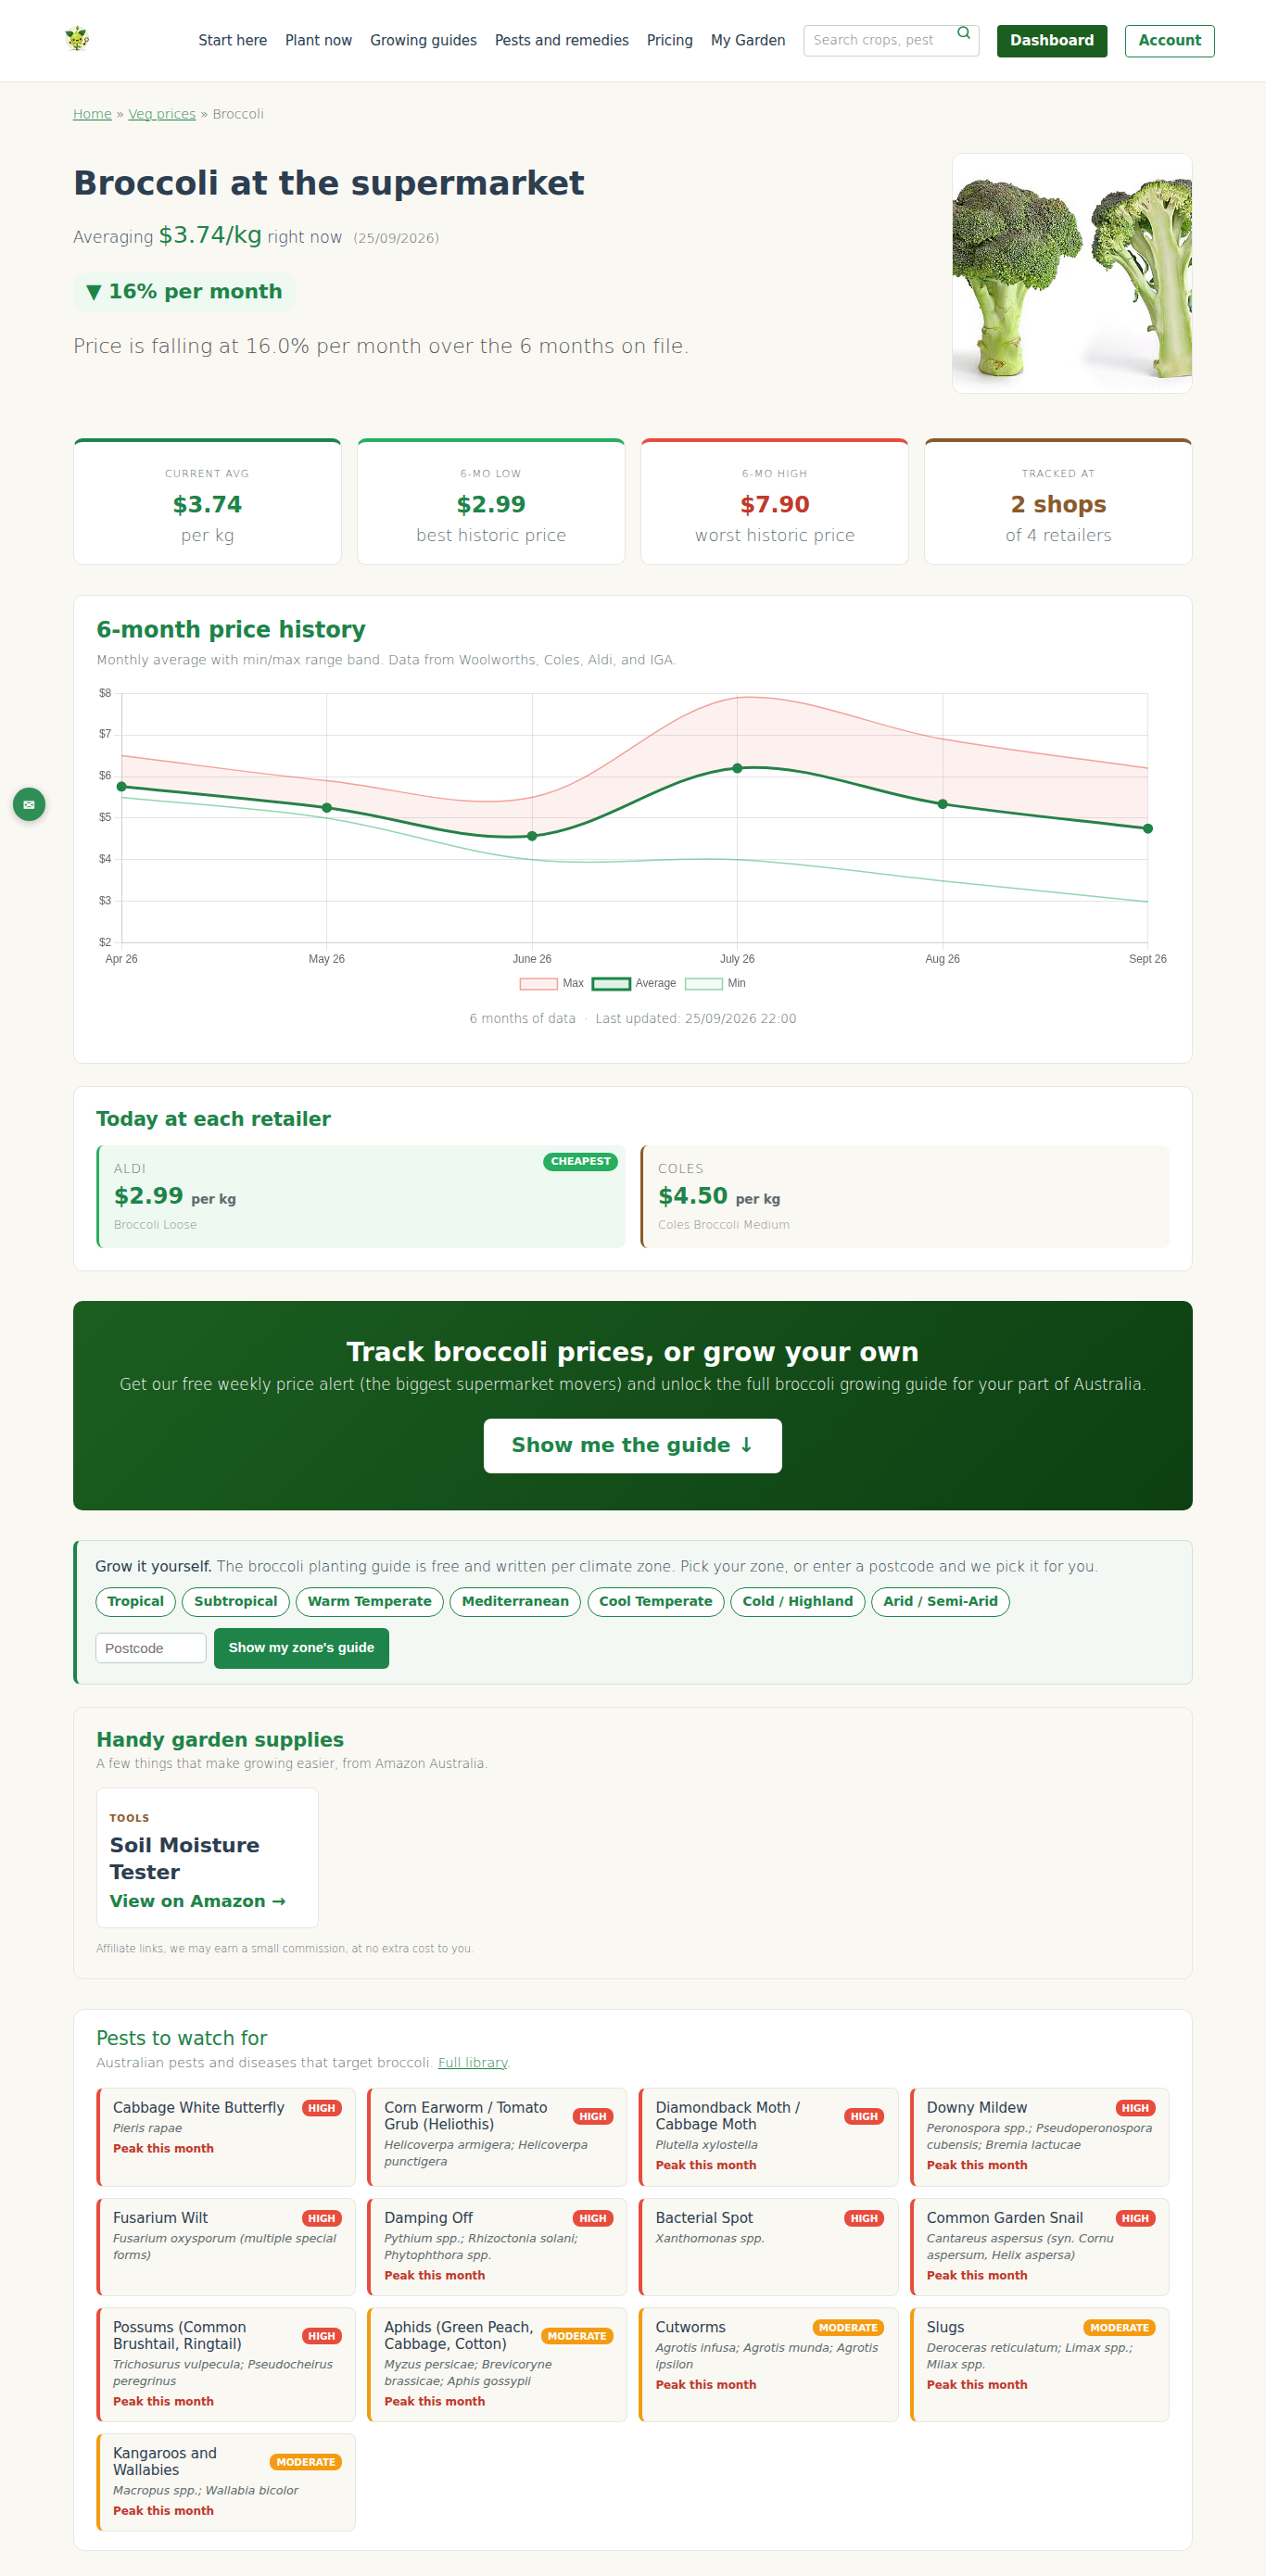
Takes you to /prices/{crop}/, the per-veggie detail page with a price history chart (the last 3 months free, the full tracked history on Starter and Pro), per-retailer breakdown, growing guide links, pest warnings, and an ROI estimate for growing it yourself. Full per-veggie page coverage.
Data freshness
Prices are collected every day, late morning:
- 10:00 AEST, collection starts across all four retailers
- 12:00 AEST, the daily figures are processed and the site is updated
If you check the tracker in the afternoon, you’re looking at that morning’s data. Before midday you’re seeing the previous day’s collection.
The collector has a 0.8% overall null rate. Per retailer:
- Woolworths (API): 0.0%, their API is stable and authoritative
- Coles (page read): 0.6%
- Aldi (page read): 2.3%, they rotate weekly specials which break the page layout we read
- IGA (page read): 0.0%
When a price is null, the crop row leaves that shop’s column blank, and the average is taken from the shops that do have one.
How members actually use the tracker
Monday morning shopping planner
Sort by Cheapest today. Shop accordingly, lettuce at Aldi this week, tomatoes at Coles. Works for households where the shopping list is flexible.
Season planning
Before autumn planting, scan the “rising” filter over the last 30 days. Crops rising consistently are usually about to peak in price, those are the high-value candidates for home growing.
ROI sanity check
If your ROI report shows broccoli at $5.80/kg and you see /prices/ displaying broccoli at $5.80/kg, the data’s aligned. If they differ substantially, there’s a caching issue, a browser hard refresh usually fixes it.