

The forecast on the news is for the city. Your garden is not in the city. A valley postcode can run three or four degrees colder overnight than the airport the forecast was written for, and that is exactly the margin where frost lives. So your dashboard now opens with Your week’s weather: seven days for your own postcode, sitting under “This week” on the Week tab.
What is on the card
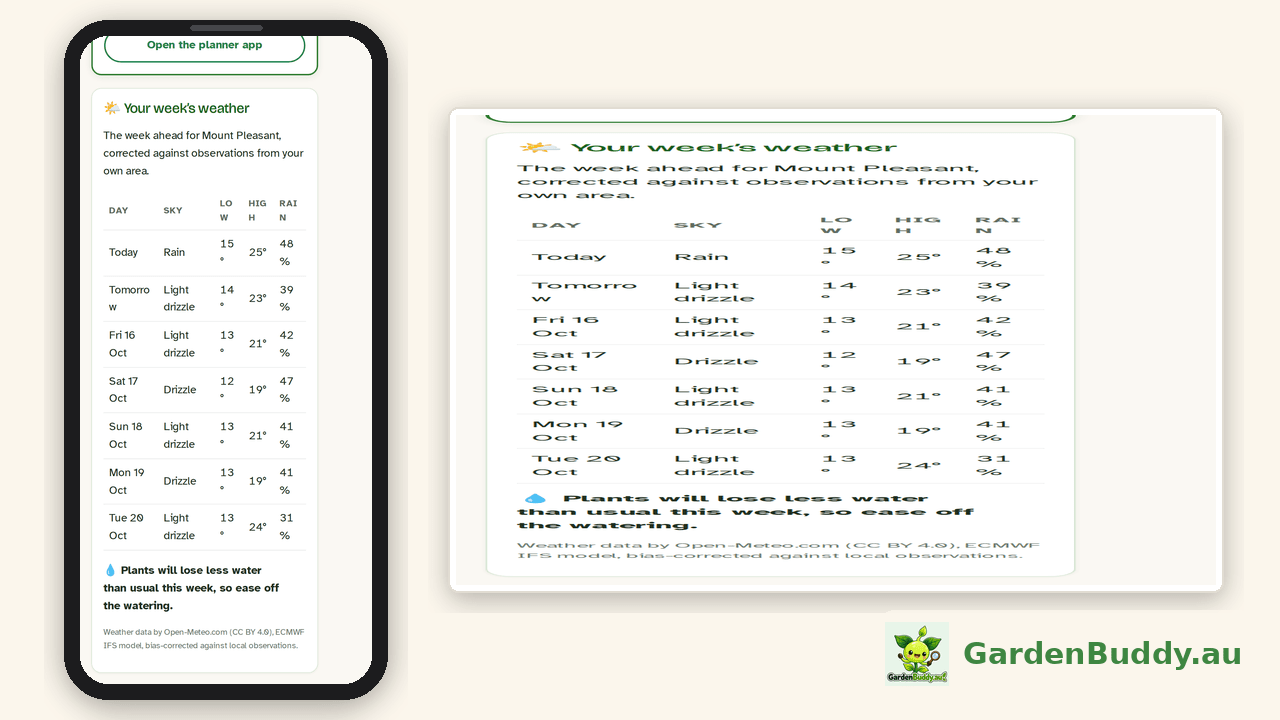
- Seven days for your postcode. Today, tomorrow, then five more days by name and date, each with the sky (rain, light drizzle, clear and so on), the overnight low, the daytime high and the chance of rain as a percentage. The postcode you set in Settings is the one the forecast is for, and the heading names the town you picked.
- Frost flags. Any day where the corrected overnight low is 2°C or below gets a “Frost risk” badge next to its sky, so the seedlings get covered before the morning, not after. We flag at two degrees rather than zero because the forecast is for the air a metre or two up, and the ground, where your seedlings are, gets colder than that on a still clear night.
- A watering read. The card adds up how much water plants will lose over the week, from the temperature, sun, wind and humidity in the forecast, and compares it with the normal for that month in your postcode. Under 85 percent of normal it says “Plants will lose less water than usual this week, so ease off the watering”. Over 115 percent it tells you to water deeper. In between, it is a usual week.
- Where it comes from. The last line on the card says it plainly: weather data by Open-Meteo.com, the ECMWF IFS model, bias corrected against local observations.

Corrected against your area’s own records
This is the part that makes it different from the forecast on your phone’s weather app. We run the European medium range model (ECMWF IFS, at 25 kilometre resolution) on our own servers, through the open source Open-Meteo software. A model at that resolution knows about the hills but not about your valley, so by itself it tends to be a bit wrong in the same direction every night for a given place.
So for every postcode we compare what the model said with what the area actually recorded, using the gridded daily climate records that cover all of Australia. The comparison looks back about two months, between 44 and 59 days depending on the postcode, and gives us three numbers per postcode: how far the model runs warm or cold on the overnight low, how far on the daytime high, and how often it calls rain compared with how often rain actually fell. Those three numbers are applied to every day of your forecast. For postcode 4521, for instance, the model has been running about one and a half degrees too warm overnight and about one degree too cool by day, and it calls a rain day about twice as often as one arrives, so the card cools the lows, warms the highs and halves the rain chance.
Across Australia the numbers look like this, as of this week:
- 2,497 of the 2,641 postcodes we serve have their own correction. The rest show the model as it is, because the area does not have enough recent records to correct against, and we would rather show you the raw model than pretend.
- The average overnight correction is about one degree. For 1,062 postcodes it is a degree or more, for 313 it is two degrees or more, and for 98 it is three degrees or more. Those last hundred are the valleys and the inland tablelands, and they are the places where a city forecast gets frost wrong.
- The corrections are rebuilt every week, early on Sunday morning, from the latest two months of records. A dry spell or a run of cold nights changes the numbers, and the card follows.
The rain chance is held between 5 and 95 percent after the correction, so the card never promises a dry day or a certain soaking. And we keep a copy of every morning’s forecast for every postcode, so once enough weeks have passed we can score the card against what actually happened and tell you how good it is, in numbers, rather than ask you to take our word for it.
Who sees what
Every member with a postcode set sees the card. On the free plan you get today and tomorrow in full; the other five rows are there but blurred, with a line that says “The full week, frost warnings and the watering read come with Starter.” The full week, the frost badges and the watering line come with Starter and every plan above it.
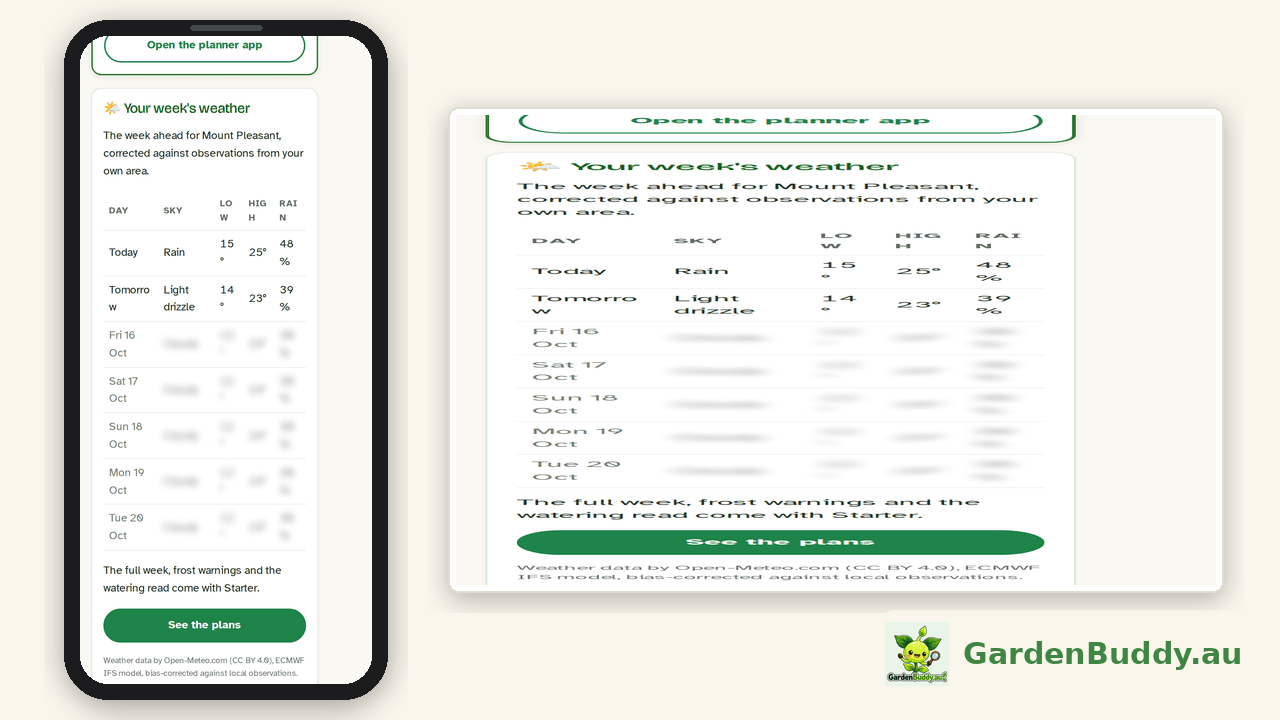
No postcode saved yet? The card asks you to set one and links to “Where you garden” in Settings. If our forecast service is ever down, the card says “The local forecast is not available right now. It usually comes back within the hour.” rather than showing you yesterday’s numbers as if they were fresh.
Where to find it
- Open your dashboard and make sure your postcode is set: Settings tab, “Where you garden”. If your postcode is shared by several towns, pick yours from the “Which town?” list, and that is the name the card uses.
- Go to the Week tab. The card sits under “This week”.
- Garden somewhere else for a while? Change the postcode in Settings and the whole card follows. Your grow zone and planting advice follow with it.
Weather data by Open-Meteo.com (CC BY 4.0), run on our own servers, like everything else here.
The GardenBuddy.au team