Before you sign up, have a look at what 60 days of my actual garden journal looks like. The demo garden at /demo-garden/ is a real plot I run in Dayboro, Queensland. It’s disclosed as a demo, but the data is mine. Same UI, same features, real plants, real numbers.

What this page is (and is not)
This is a real subtropical Brisbane vegetable plot I manage myself. Real seeds I bought at real prices from real Australian suppliers. My actual rainwater tank on the watering. Real pests I sighted and treated. Harvests I weighed on my kitchen scales.
What it is not:
- Not a fake “meet Sarah” persona. I don’t make up customers. My garden is labelled clearly as a demo, and I run it myself.
- Not cherry-picked. I log everything, including the snow peas that are slow this year, the coriander that bolted in three weeks, and the kale developing aphid pressure.
- Not a member’s private data. Real member gardens are strictly private. Their data is database-scoped to their own user ID and never visible to anyone else.
Most gardening apps demo with photoshopped perfect plants and conveniently dated entries. My demo shows the actual mess of growing food: a snow pea behind schedule, a broccoli that needed BT spray on day 37, a coriander that bolted, and an honest note where supermarket price data is thin. That is what gardening looks like. My demo represents that, not some fantasy version of it.
What you will see when you scroll
The page renders top to bottom in the same order as a member’s My Garden hub, plus a couple of demo-specific sections. Here is what each block contains and how I’d read it.
Hero stats
Five KPI tiles at the top: bed count, active plants, care events logged, harvests recorded, total dollar value grown. The ROI dollar is calculated from the same price data my whole product runs on, today’s average $/kg across Woolworths, Coles, Aldi and IGA.
Activity summary

Activity tiles count every care event by type. In my current cycle, the demo’s activity summary includes:
- Watering events with total litres of rainwater applied from the tank
- Fertilising rounds (Seasol plus Powerfeed dilutions) with dates
- Mulching events (sugar-cane bales applied) with quantities
- Pest treatments and preventative pest checks
- Sowing, transplanting and harvesting events
- A flagged pest-issue count
Plants with full provenance
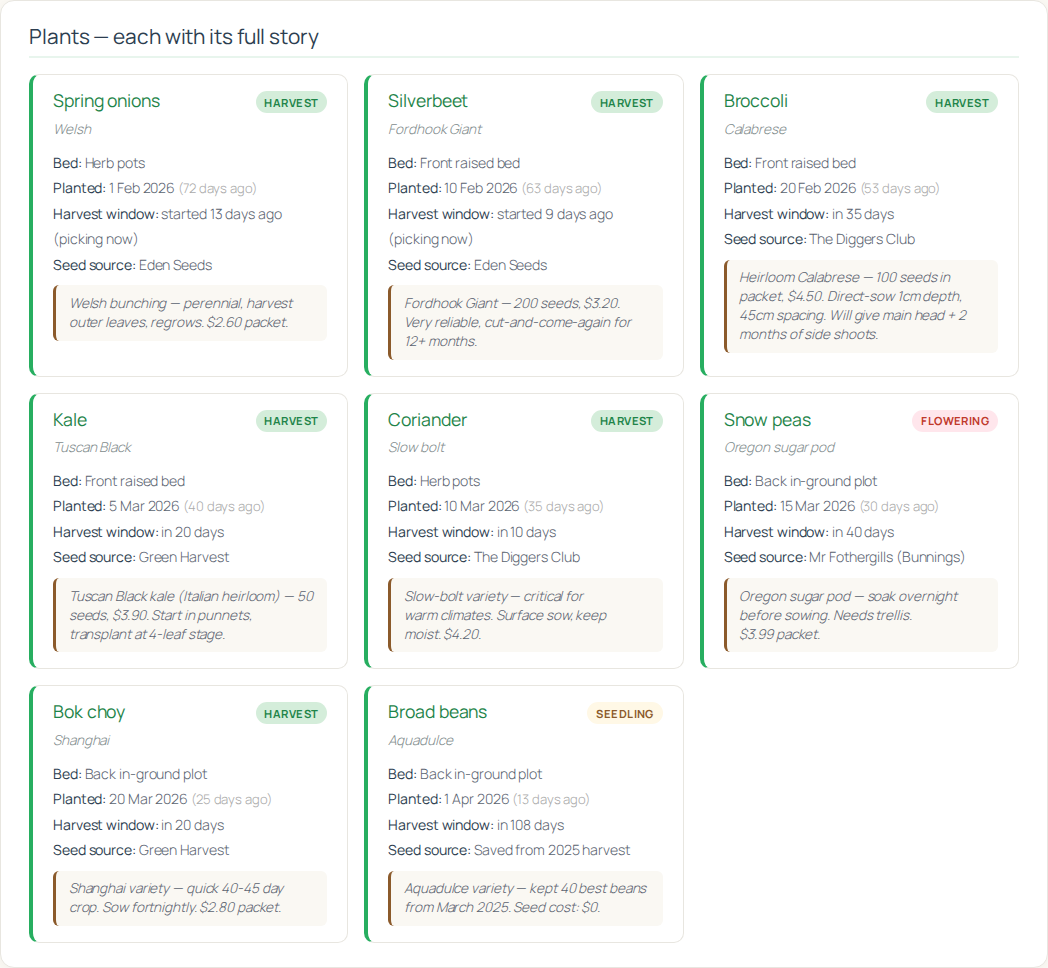
Each plant card shows its full history at a glance. My demo garden currently has 8 active plants: Calabrese broccoli, Tuscan Black kale, Fordhook Giant silverbeet, Oregon sugar pod snow pea, Aquadulce broad bean, Shanghai pak choi, Slow bolt coriander and Welsh onion. For each one I record:
- Crop and variety, for example “Broccoli, Calabrese” or “Kale, Tuscan Black”
- Bed it is planted in
- Planting date with a days-in-ground counter
- Harvest window, when it should start producing
- Seed source, where I bought the seed and what it cost (for example “Green Harvest, Tuscan Black, $3.90”)
- Notes, variety detail, growing tips, what I’ve learned
- Growth stage badge: Seedling, Growing, Flowering or Harvest
Seed source data feeds directly into the ROI calculation. “$4.50 for this broccoli packet” becomes part of my grow versus buy maths.
The garden diary
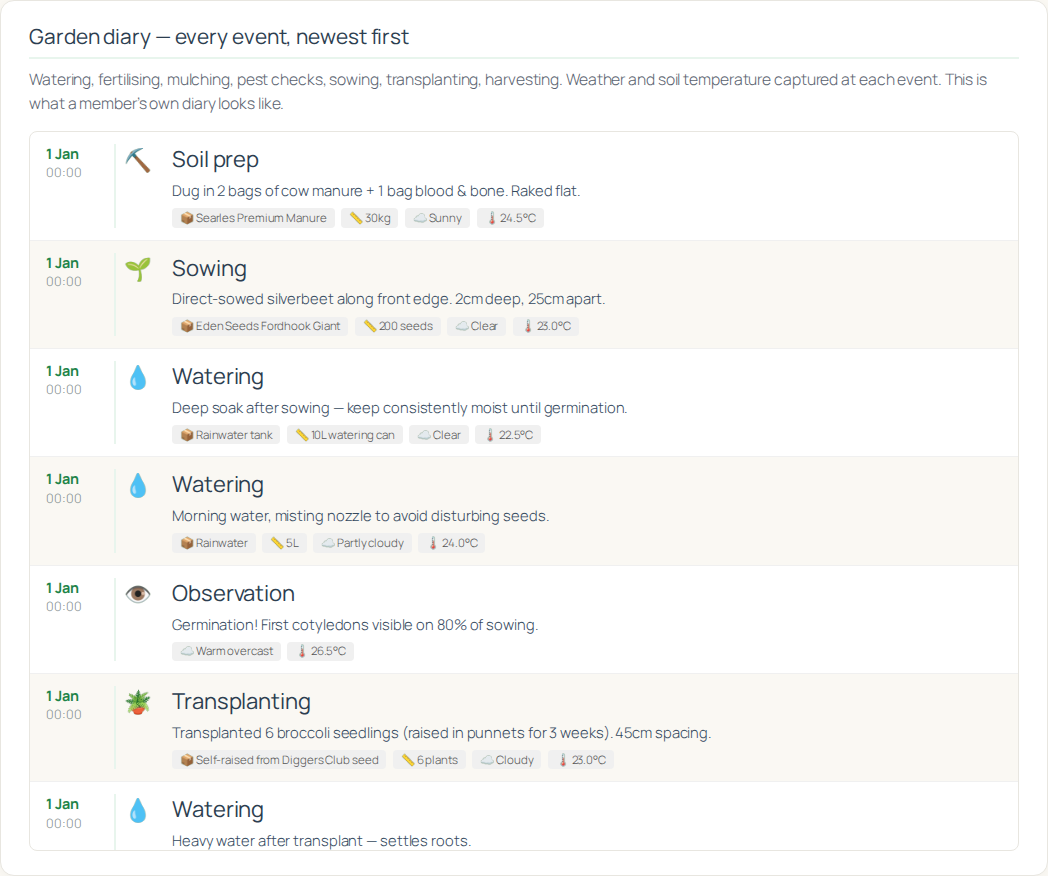
This is the most useful part of the demo to scroll through. Fifty-three entries, chronologically newest-first, each with:
- Date and time of the event
- Care-type icon (watering, fertilising, mulching, pest treatment, sowing, and others)
- Plant or bed it relates to
- Description in plain English
- Product used, for example “Yates Dipel BT bacillus thuringiensis”
- Quantity used, for example “15 mL in 5 L”
- Weather conditions at the time of the event
- Soil or air temperature if I captured it
Scroll back far enough and you can see my whole season unfold: bed prep, sowing silverbeet, transplanting broccoli punnets, first fertiliser, cabbage white butterfly on day 25, Dipel applied, netting deployed on day 30, first silverbeet harvest, aphids on kale, neem applied, lady beetles taking over the pest control. I reckon that sequence is abotu as honest a picture of a real garden as you’ll find in any app.
Pest observations and treatments
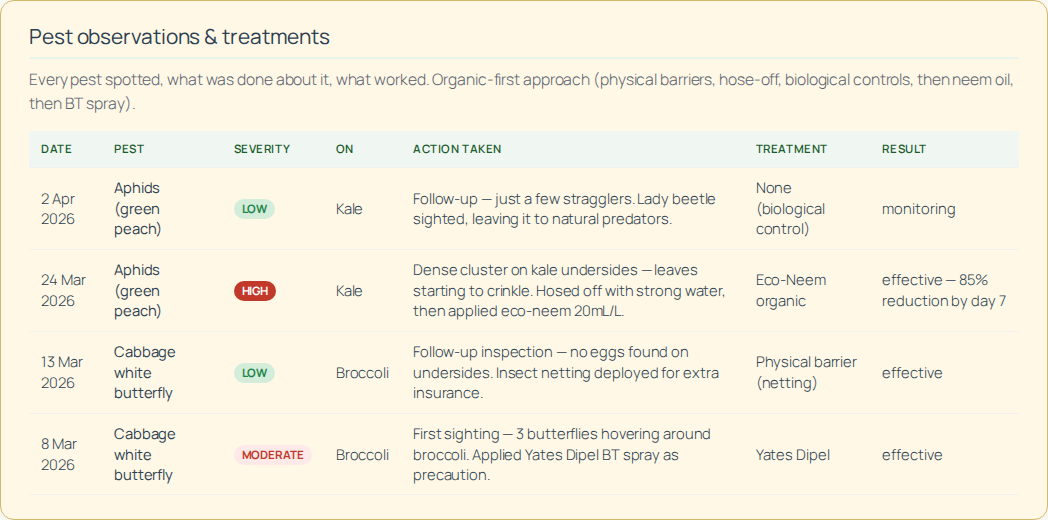
Four detailed pest entries showing organic-first escalation in practice:
- Cabbage white butterfly: sighted day 23. Applied Yates Dipel BT spray. Five days later, no eggs found. I deployed netting as insurance.
- Aphids on kale: high severity on day 39. I hosed them off and applied Eco-Neem. Day 48 follow-up showed 85% reduction. Lady beetles moved in and biological control took over from there.
Each entry records not just what happened but what worked. I track effectiveness 7 to 14 days after treatment so I know which approach to use next season.
Upcoming tasks
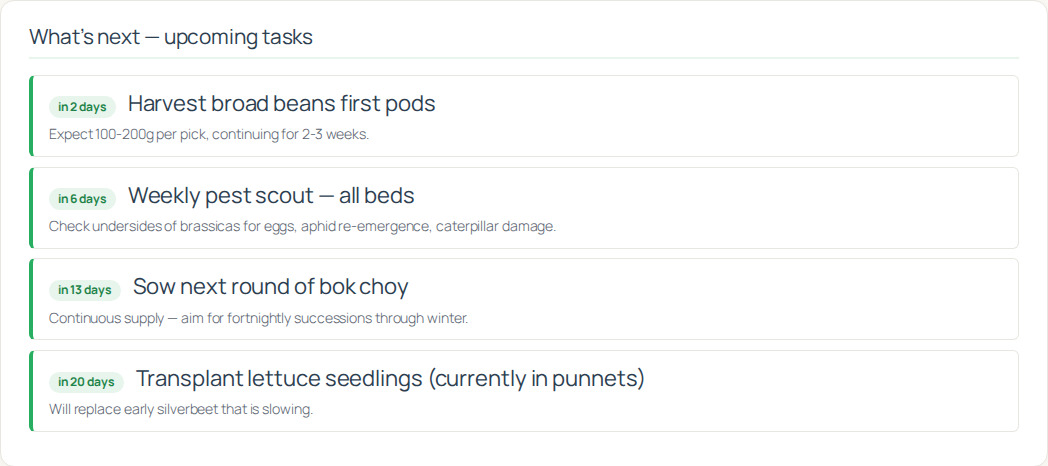
Tasks are not auto-generated. I add them when I plan ahead. Currently queued in my demo:
- Harvest broad beans, first pods
- Weekly pest scout across all beds
- Sow next round of bok choy for succession supply
- Transplant lettuce seedlings
Harvest history
Twelve harvest entries so far, totalling 4.28 kg, each with date, crop, weight in kilograms and quality rating. The kind of granular log that, multiplied across a real season, lets you compare year on year. “Autumn 2026 kale yielded 2.2 kg; autumn 2025 was 1.8 kg.” That is my goal with this feature: make the data yours to keep.
ROI report
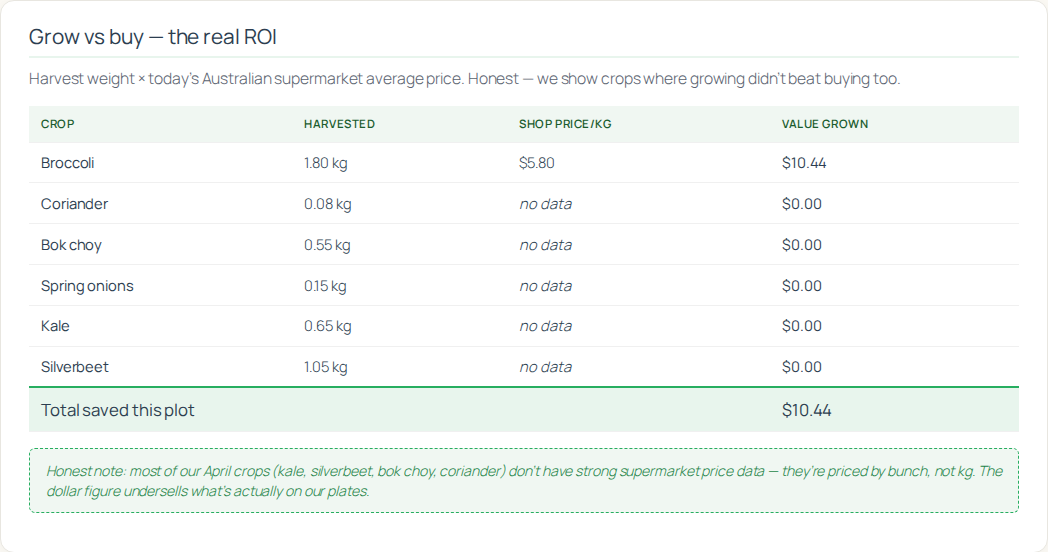
My grow versus buy table. Each crop’s harvest weight times today’s average shop price per kg equals the dollar value I’ve grown. That’s the number I put on the page.
I’ve added an honest disclaimer at the bottom: kale and silverbeet are sold by the bunch (not by weight) at most supermarkets, so my per-kg price data for those two is thin. The dollar figure undersells what’s actually on my plate for leafy greens. I’d rather tell you that than pretend the number is perfect.
What to look for that is instructive
- The 23 day gap between sowing silverbeet and my first outer-leaf harvest. Silverbeet is faster than most people realise.
- The 14 day delay between the cabbage white butterfly sighting and zero damage. BT works, but slowly. Physical netting is the play for the rest of the season.
- The aphid biological follow-up. One round of neem plus 7 days equals a lady beetle population that does the rest. I stopped spraying after that and let them work.
- The honest ROI note. I don’t pretend the dollar figure is gospel. For kale and silverbeet it undersells what I’ve grown.
I log events to my demo garden as I do them in real life, same as any member would. The garden grows, my plants mature, I weigh and record each harvest, pests come and go. The demo updates continuously, not as a fixed snapshot. What you see today is what I did this week.
After you have seen the demo
If the product looks like something you’d use, the next page walks you through signing up. Takes abotu three minutes end to end.